Commodities continue to look to Eurozone debt crisis management
strategy to guide sentiment. Guidance within a batch of Q3 earnings
reports is likewise in focus.
Talking Points
- FinMin Summit, Merkel and Draghi Key with Euro Debt Crisis Policy in Focus
- Greek Bill Auction Results May Reveal Markets’ Satisfaction with EU Efforts
- Guidance in Q3 Earnings Reports May Shape Growth Outlook, Risk Appetite
The focus remains on a meeting of Eurozone finance ministers in
Luxembourg. Against this backdrop, ECB President Mario Draghi is due to
speak before the European Parliament Economy Committee while German
Chancellor Angela Merkel visits Greece.
Traders continue to look for signs of reconciliation between Athens
and “troika” monitors that open the door for disbursement of the latest
batch of bailout funding. Guidance on the likelihood and timing of a
Spanish request for a full-on rescue package is also sought.
The results of a Greek bill auction may offer a timely gauge of
investors’ perception of policymakers’ progress, with markets eyeing
average yield and bid-to-cover readings. The poster-child for the
Eurozone debt crisis will attempt to sell €1 billion in 6-month paper.
The economic calendar remains lackluster but the third-quarter
corporate earnings docket may prove market-moving as Chevron Corp, Yum!
Brands Inc and Alcoa Inc report results. All three companies are
relatively sensitive to trends in the global business cycle, meaning
traders will be keen to comb through their guidance on likely
performance going forward to help shape risk appetite trends.
On balance, a net sentiment-negative outcome to the varied mix of
catalysts on offer stands to weigh growth-anchored crude oil and copper
prices. Meanwhile, gold and silver may decline as ebbing risk appetite
boosts haven demand for the US Dollar. Needless to say, a broadly
risk-positive tone is likely to produce the inverse dynamic.
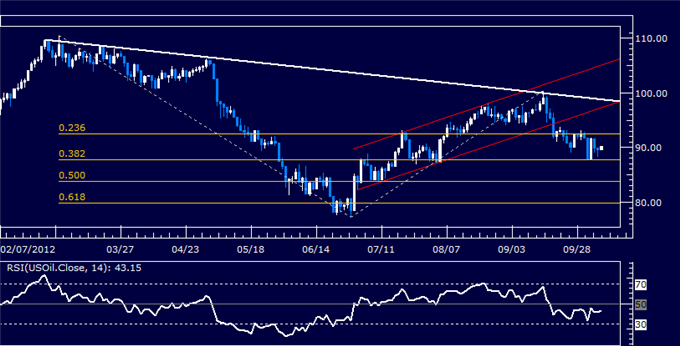
WTI Crude Oil (NY Close): $89.33 // -0.55 // -0.61%
A burst of seesaw volatility last week has left prices locked between
support at 87.70 and resistance at 92.56, the 38.2% and 23.6% Fibonacci
expansions respectively. A break above resistance exposes the underside
of a rising channel set from early July, now at 97.21. Alternatively, a
drop through support targets the 50% expansion at 83.76.
Daily Chart – Created Using FXCM Marketscope 2.0
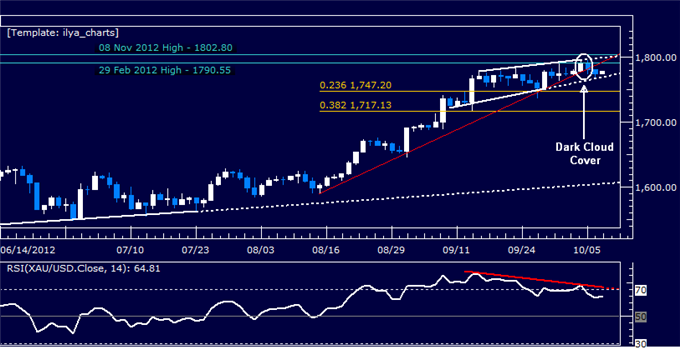
Spot Gold (NY Close): $1774.95 // -5.65 // -0.32%
Prices broke through support at a rising trend line set from
mid-August after completing a bearish Dark Cloud Cover candlestick
pattern below resistance in the 1790.55-1802.80 area, hinting a move
lower is ahead. Negative RSI divergence reinforces the case for a
downside scenario. Secondary support at the bottom of a Rising Wedge
chart pattern is now at 1769.30, with a break below that exposing the
23.6% Fibonacci retracement at 1747.20. Alternatively, a break above
1802.80 targets 1850.00 and the 1900/oz figure.
Daily Chart – Created Using FXCM Marketscope 2.0
Want to learn more about RSI? Watch this Video.
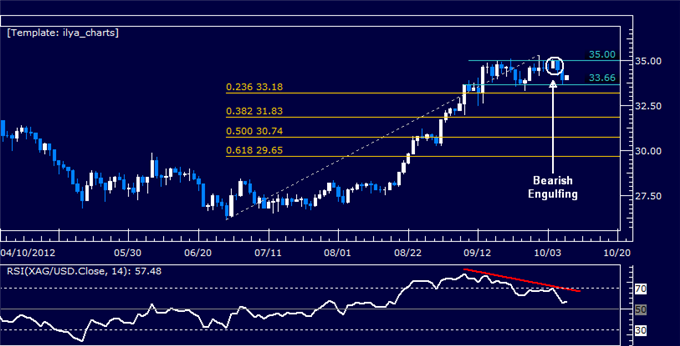
Spot Silver (NY Close): $33.98 // -0.54 // -1.56%
Prices followed the completion of a Bearish Engulfing candlestick
pattern with a drop to range support at 33.66, a barrier reinforced by
the 23.6% Fibonacci retracement at 33.18. A break below the latter
boundary exposes the 38.2% Fib at 31.83. Negative RSI divergence
reinforces the case for a downside scenario. Near-term resistance stands
at the 35.00 figure, with a break above that initially targeting the
October 28 2011 high at 35.66.
Daily Chart – Created Using FXCM Marketscope 2.0
Want to learn more about RSI? Watch this Video.
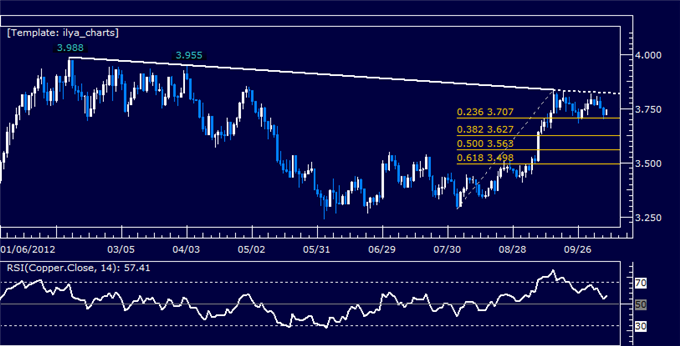
COMEX E-Mini Copper (NY Close): $3.718 // -0.060 // -1.59%
Prices continue to consolidate below resistance at a falling trend
line set from early February (3.821). A break higher exposes swing highs
at 3.955 and 3.988. Near-term support lines up at 3.707, the 23.6%
Fibonacci retracement. A push below that targets the 38.2% level at
3.627.
Daily Chart – Created Using FXCM Marketscope 2.0


0 التعليقات:
Post a Comment
Note: Only a member of this blog may post a comment.